How to Read a Label and Predict What Your Glucose Will Do
Dr. Lindsey VanDyke MD | Endocrinologist | AIDENDO
Protein bars are everywhere. They line the checkout aisle at Target, fill entire sections at Whole Foods, and show up in gym bags across the country. But if you have insulin resistance, prediabetes, or diabetes, most of these bars are doing more harm than good — and the packaging won’t tell you that.
I’m going to walk you through the one metric that matters most when choosing a protein bar, and then I’ll break down seven popular bars so you can see exactly how they compare.
The One Number That Predicts Your Blood Sugar Response
Some people count total carbs. Some reference the glycemic index. Both have value, but in my practice, the metric I rely on — and the one your dietitian should be echoing — is the carbohydrate-to-protein ratio.
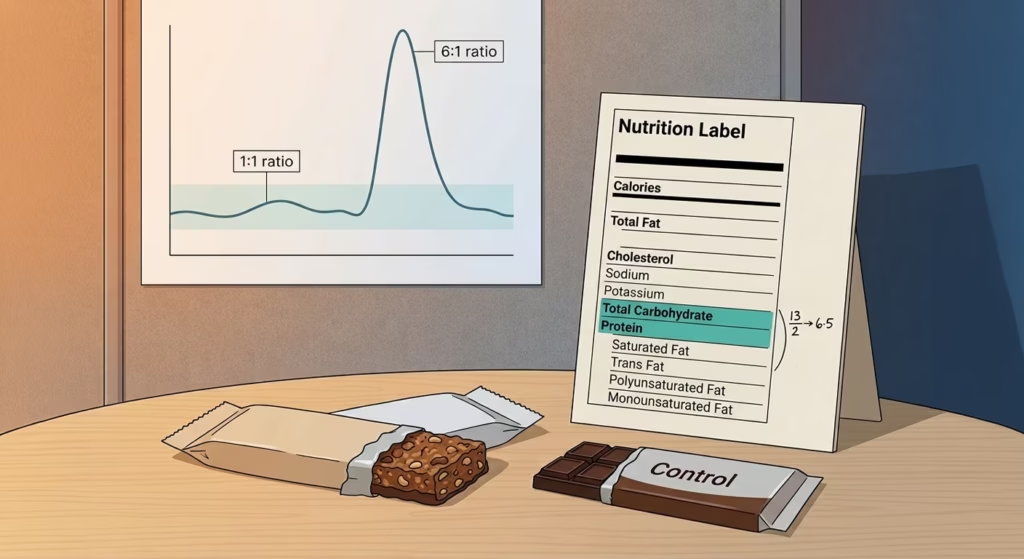
The logic is straightforward. Carbohydrates raise blood sugar. That’s their primary metabolic function. But other macronutrients — protein, fat, and fiber — slow down the rate at which those carbohydrates hit your bloodstream. When you see a bar with roughly equal grams of carbs and protein (a ratio near 1:1), the blood sugar response tends to be subtle. A gentle rolling curve. When the ratio climbs to 3:1, 5:1, or higher, you’re looking at significant glucose spikes.
The Rule of Thumb
- Aim for a carb-to-protein ratio as close to 1:1 as possible. At 1:1, blood sugar changes are minimal.
- At 3:1 or above, expect meaningful spikes.
- At 6:1 or higher, you’re essentially eating a candy bar as far as your glucose is concerned.
The math is simple: divide total carbohydrates by total protein. That number tells you more about what your blood sugar will do than the calorie count, the ingredient list, or whatever health claim is printed on the front of the package.
The Comparison: 7 Popular Bars, Ranked
I set up a comparison using a Choco Love dark chocolate bar as the control — a product nobody considers a health food. Serving size: one-third of the bar. 150 calories. 13 grams of carbohydrates. 2 grams of protein. That gives us a ratio of 6.5. Any bar that performs worse than chocolate is a bar you should reconsider.
| Bar | Calories | Carbs (g) | Protein (g) | Ratio | Blood Sugar Impact |
|---|---|---|---|---|---|
| Pure Protein | 200 | 17 | 20 | 0.85 | Excellent |
| Quest (Cookies & Cream) | 190 | 22 | 21 | 1.05 | Excellent |
| RX Bar | 190 | 24 | 12 | 2.00 | Good |
| Luna Bar | 210 | 24 | 9 | 2.70 | Fair |
| KIND (Cranberry Almond) | 160 | 19 | 5 | 3.80 | Fair |
| Clif Bar | 260 | 42 | 9 | 4.67 | Poor |
| Choco Love (Control) | 150 | 13 | 2 | 6.50 | Poor |
| Larabar | 230 | 27 | 4 | 6.75 | Poor |
Bar-by-Bar Breakdown
Pure Protein — Ratio: 0.85 (Excellent)
Better than one-to-one. With 17 grams of carbohydrates and 20 grams of protein, this bar is doing exactly what you want: the protein outweighs the carbs. You’d expect a very level blood sugar response following this bar. For my patients managing insulin resistance or diabetes, this is one of the safest choices on the shelf.
Quest (Cookies & Cream) — Ratio: 1.05 (Excellent)
Nearly perfect on paper. 22 grams of carbohydrates, 21 grams of protein, and — worth noting — 13 grams of fiber. That fiber content is unusually high for a protein bar and provides additional buffering against glucose spikes. Available at any Target or grocery store. For blood sugar management, this is a strong option.
RX Bar — Ratio: 2.0 (Good)
Marketed as a whole-food, minimal-ingredient bar. The numbers: 24 grams of carbs, 12 grams of protein, 4 grams of fiber. A ratio of 2.0 isn’t bad, but it’s far enough from 1:1 that I’d recommend pairing it with a handful of almonds or another protein source to further slow carbohydrate absorption.
Luna Bar — Ratio: 2.7 (Good, with caveats)
Marketed to women as a “whole nutrition” bar. 24 grams of carbs, 9 grams of protein. At 2.7, it’s not terrible — but it’s far enough from the target that you’re likely to see a noticeable glucose response. Adding protein on the side (nuts, cheese, a hard-boiled egg) would bring the effective ratio closer to where you want it.
KIND (Cranberry Almond) — Ratio: 3.8 (Fair)
KIND bars are marketed as nut-based, whole-food options. The cranberry almond flavor comes in at 19 grams of carbs with 5 grams of protein and 5 grams of fiber. That glaze binding the nuts together is adding to the carbohydrate load. At 3.8, this is more than halfway to the chocolate bar control. It’s a snack, not a blood-sugar-friendly protein bar.
Clif Bar — Ratio: 4.67 (Poor)
Clif bars have been around for decades and are heavily marketed to athletes. When I was doing 50- and 100-mile cycling routes, I relied on them because sustained endurance exercise requires a steady stream of carbohydrates. But if you’re living the diabetes lifestyle, this bar presents real challenges. 42 grams of carbohydrates — that’s cereal-level — against only 9 grams of protein. The 5 grams of fiber help slightly, but at a ratio of 4.67, this bar will move your glucose significantly. Worse than the chocolate control.
Larabar — Ratio: 6.75 (Poor)
This is the one that surprises people. Larabars are aggressively marketed as a whole-food option — “just two real ingredients.” And that’s true. But “real ingredients” and “good for blood sugar” are not the same claim. 27 grams of carbs, 4 grams of protein. A ratio of 6.75 — worse than our chocolate bar control. If you’re choosing this thinking it’s a healthy option for glucose management, the data says otherwise.
How to Use This in the Real World
- Check the serving size. Some bars list nutritional information for half a bar or one-third of a bar. If you’re eating the whole thing, you need to adjust the numbers accordingly.
- Find total carbohydrates and total protein. Divide carbs by protein. That’s your ratio.
- Aim for 1:1 or below. If you’re above 2:1, consider pairing the bar with a protein source. Above 4:1, I’d look for a different bar entirely.
- Look for bonus fiber. Fiber slows carbohydrate absorption. Bars with 5+ grams of fiber are providing additional glucose protection beyond what the ratio alone captures.
- Verify with your own data. If you’re wearing a continuous glucose monitor, this is where the proof meets the pudding. How you respond to a food — how your body handles a specific carb-to-protein ratio — is the thing that matters most. The math gets you in the ballpark. Your sensor tells you the truth.
The Bottom Line
Marketing claims don’t predict blood sugar. The carb-to-protein ratio does. A bar with “only two real ingredients” can spike your glucose more than a chocolate bar. A bar you’ve never heard of might keep your levels completely flat. Read the label. Do the math. Then let your body confirm it.
About Dr. VanDyke
Dr. Lindsey VanDyke is a board-certified endocrinologist and the founder of AIDENDO, a direct-care endocrinology practice. She specializes in insulin resistance, diabetes management, thyroid conditions, cortisol disorders, and menopause-related metabolic changes. AIDENDO offers telehealth appointments in TX, CA, CO, OR, WA, OK, and NM.
Book a consultation: aidendo.com | Patient app: DIA Direct